

Introduction
Variables are one of the most transformative features in DAX. They revolutionized how we write formulas, making complex calculations readable, maintainable, and significantly faster.
Before variables, DAX formulas often became tangled webs of nested functions that were difficult to understand and debug. Today, variables allow us to break down complex logic into named, meaningful components that tell a clear story.
This article will transform how you write DAX. By the end, you will understand not just the syntax of variables, but the patterns and practices that separate average DAX from truly professional code.
Why Variables Matter
Variables solve three critical problems in DAX development: readability, performance, and debugging. Let us examine each.
The Readability Problem
Consider this formula without variables:
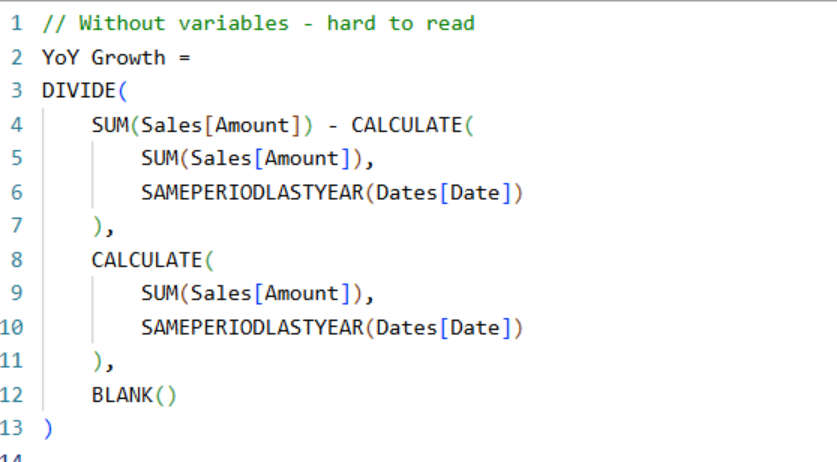
This formula calculates year-over-year growth, but understanding it requires mental parsing. You need to trace through nested functions to understand what is happening.
Now compare with variables:
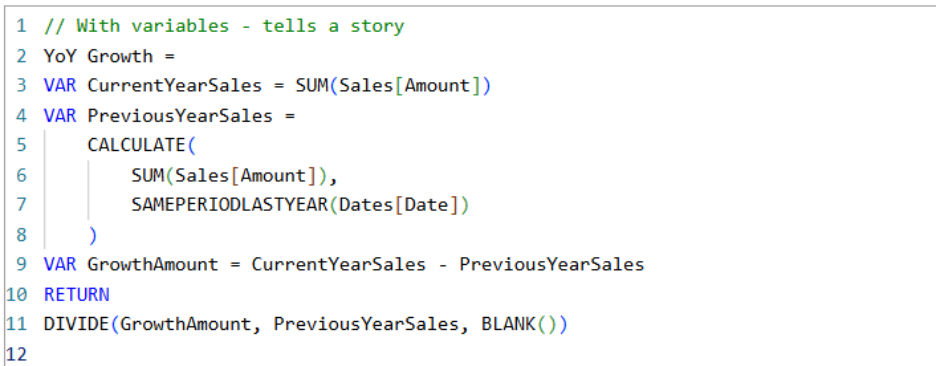
The variable names create a narrative: we calculate current year sales, previous year sales, determine the growth amount, and return the percentage. Anyone reading this code immediately understands the logic.
The Performance Problem
In the first example without variables, SUM(Sales [Amount]) with SAMEPERIODLASTYEAR is calculated twice. The DAX engine must evaluate this expensive operation for each cell in your visual, doubling the work.
Variables are evaluated exactly once, when they are defined. Every subsequent reference to that variable uses the cached result. This is not just a minor optimization; in complex reports with millions of rows, this can mean the difference between a 2-second refresh and a 20-second refresh.
💡 Performance Rule
If you reference the same calculation more than once, always use a variable. The performance gain is automatic and significant.
The Debugging Problem
When a complex formula returns unexpected results, finding the issue in nested functions is like finding a needle in a haystack. With variables, you can isolate each step and identify exactly where the calculation goes wrong.
We will explore specific debugging techniques later in this article.
VAR/RETURN Syntax
The Basic Pattern
Every variable-based formula follows the same structure:
Measure Name =
VAR VariableName1 = <expression1>
VAR VariableName2 = <expression2>
VAR VariableName3 = <expression using previous variables>
RETURN
<final expression>
Key syntax rules:
- VAR: Declares a variable and assigns a value
- RETURN: Marks the beginning of the result expression (required)
- Variable names: No spaces, start with letter, case-insensitive
- Order matters: Variables can only reference previously defined variables
- Immutable: Once defined, a variable's value cannot change
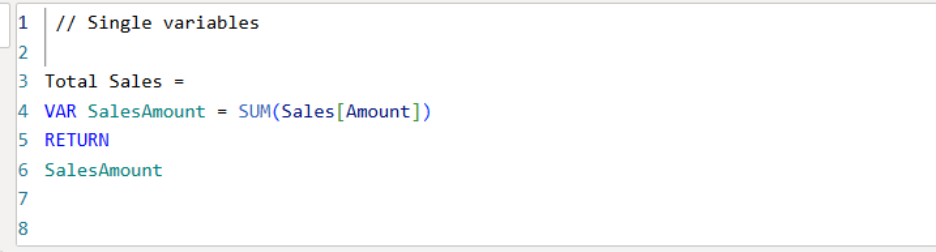
Simple Examples
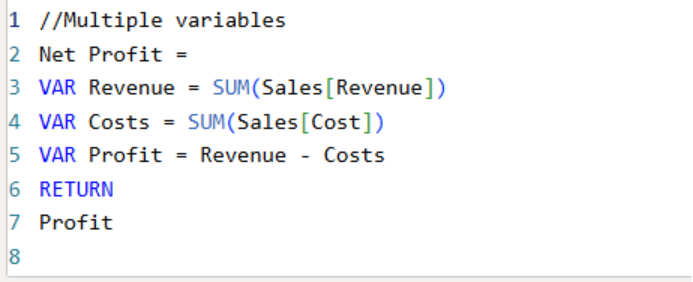
Multiple variables
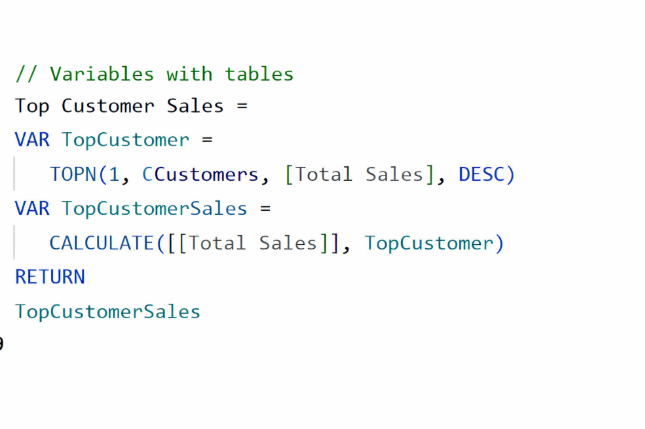
Variables with tables
Variables Can Store Any Data Type
Variables are not limited to numbers. They can store any DAX data type:
| Data Type | Description | Example |
| Scalar | Single value (number, text, date) | VAR Total = SUM(Sales[Amount]) |
| Table | Full table or filtered table | VAR TopProducts = TOPN(10, Products) |
| Text | String values | VAR Label = "Total: " |
| Boolean | TRUE or FALSE | VAR HasData = NOT(ISBLANK(Total)) |
| Date | Date/datetime values | VAR LastDate = MAX(Sales[Date]) |
Essential VAR Patterns
Let us explore the most common and useful patterns for using variables in real-world scenarios.
Pattern 1: Comparison Calculations
Comparing values across different contexts is one of the most common DAX tasks. Variables make this clean and efficient.
// Actual vs Budget comparison
Variance Analysis =
VAR Actual = [Total Sales]
VAR Budget = [Budget Amount]
VAR Variance = Actual - Budget
VAR VariancePercent = DIVIDE(Variance, Budget, 0)
RETURN
VariancePercent
Pattern 2: Conditional Logic
Complex IF/SWITCH statements become much clearer when you pre-calculate the values being compared.
// Performance indicator
Performance Status =
VAR Actual = [Total Sales]
VAR Target = [Sales Target]
VAR Achievement = DIVIDE(Actual, Target, 0)
RETURN
SWITCH(
TRUE(),
Achievement >= 1.2, "Exceptional",
Achievement >= 1.0, "On Target",
Achievement >= 0.8, "At Risk",
"Critical"
)
// Dynamic formatting text
Sales Summary =
VAR CurrentSales = [Total Sales]
VAR PriorSales = [Sales LY]
VAR Change = CurrentSales - PriorSales
VAR Direction = IF(Change >= 0, "up", "down")
VAR Formatted = FORMAT(ABS(Change), "$#,##0")
RETURN
"Sales are " & Direction & " " & Formatted & " vs last year"
Pattern 3: Table Variables for Filtering
Store filtered tables in variables to reuse complex filter logic.
// Calculate metrics for top products only
Top 10 Product Revenue =
VAR Top10Products =
TOPN(
10,
ALL(Products[ProductName]),
[Total Sales],
DESC
)
VAR Top10Revenue =
CALCULATE(
[Total Sales],
Top10Products
)
RETURN
Top10Revenue
// Customers who purchased in both years
Returning Customer Sales =
VAR CustomersThisYear =
CALCULATETABLE(
VALUES(Sales[CustomerID]),
YEAR(Dates[Date]) = YEAR(TODAY())
)
VAR CustomersLastYear =
CALCULATETABLE(
VALUES(Sales[CustomerID]),
YEAR(Dates[Date]) = YEAR(TODAY()) - 1
)
VAR ReturningCustomers =
INTERSECT(CustomersThisYear, CustomersLastYear)
RETURN
CALCULATE([Total Sales], ReturningCustomers)
Pattern 4: Capturing Context
Variables capture the filter context at the moment they are defined. This is crucial for calculations that need to compare different contexts.
// Percentage of parent (category % of total)
% of Total Category =
VAR CurrentSales = [Total Sales]
VAR CategoryTotal =
CALCULATE(
[Total Sales],
ALLEXCEPT(Products, Products[Category])
)
RETURN
DIVIDE(CurrentSales, CategoryTotal, BLANK())
// Running total that respects row context
Running Total =
VAR CurrentDate = MAX(Dates[Date])
VAR RunningSum =
CALCULATE(
[Total Sales],
Dates[Date] <= CurrentDate,
ALL(Dates[Date])
)
RETURN
RunningSum
Pattern 5: Breaking Down Complex Calculations
For complex business logic, variables let you build calculations step by step.
// Weighted average cost of capital (WACC)
WACC =
VAR DebtValue = SUM(Financials[DebtAmount])
VAR EquityValue = SUM(Financials[EquityAmount])
VAR TotalCapital = DebtValue + EquityValue
VAR DebtWeight = DIVIDE(DebtValue, TotalCapital, 0)
VAR EquityWeight = DIVIDE(EquityValue, TotalCapital, 0)
VAR CostOfDebt = AVERAGE(Financials[InterestRate])
VAR CostOfEquity = AVERAGE(Financials[RequiredReturn])
VAR TaxRate = 0.21
VAR AfterTaxDebtCost = CostOfDebt * (1 - TaxRate)
RETURN
(DebtWeight * AfterTaxDebtCost) + (EquityWeight * CostOfEquity)
Debugging Techniques
Variables transform debugging from a frustrating guessing game into a systematic process. Here are proven techniques.
Technique 1: Return Intermediate Values
The simplest debugging technique: temporarily change what you return to inspect intermediate calculations.
// Original measure
Profit Margin =
VAR Revenue = SUM(Sales[Revenue])
VAR Cost = SUM(Sales[Cost])
VAR Profit = Revenue - Cost
VAR Margin = DIVIDE(Profit, Revenue, 0)
RETURN
Margin
// Debug: Check if Revenue is correct
Profit Margin =
VAR Revenue = SUM(Sales[Revenue])
VAR Cost = SUM(Sales[Cost])
VAR Profit = Revenue - Cost
VAR Margin = DIVIDE(Profit, Revenue, 0)
RETURN
Revenue // <-- Temporarily return Revenue to inspect
// Debug: Check if Cost is the issue
Profit Margin =
VAR Revenue = SUM(Sales[Revenue])
VAR Cost = SUM(Sales[Cost])
VAR Profit = Revenue - Cost
VAR Margin = DIVIDE(Profit, Revenue, 0)
RETURN
Cost // <-- Now check Cost
💡 Pro Tip
Work backwards from the RETURN statement. If the final result is wrong, check each variable in reverse order until you find the first one that returns unexpected values.
Technique 2: Create Debug Output
Concatenate multiple values into a debug string to see everything at once.
// Debug version showing all intermediate values
Profit Margin DEBUG =
VAR Revenue = SUM(Sales[Revenue])
VAR Cost = SUM(Sales[Cost])
VAR Profit = Revenue - Cost
VAR Margin = DIVIDE(Profit, Revenue, 0)
RETURN
"Rev: " & FORMAT(Revenue, "$#,##0") &
" | Cost: " & FORMAT(Cost, "$#,##0") &
" | Profit: " & FORMAT(Profit, "$#,##0") &
" | Margin: " & FORMAT(Margin, "0.0%")
Technique 3: Check Data Types
Unexpected results often come from data type mismatches. Use variables to isolate and verify.
// Debugging date comparisons
Date Filter Debug =
VAR MaxDateInContext = MAX(Dates[Date])
VAR FilterDate = DATE(2024, 1, 1)
VAR Comparison = MaxDateInContext >= FilterDate
RETURN
"Max Date: " & FORMAT(MaxDateInContext, "YYYY-MM-DD") &
" | Filter: " & FORMAT(FilterDate, "YYYY-MM-DD") &
" | Result: " & Comparison
Technique 4: Verify Filter Context
When calculations behave differently than expected, verify what filter context actually exists.
// Check what filters are active
Context Debug =
VAR SelectedYear = SELECTEDVALUE(Dates[Year], "Multiple")
VAR SelectedCategory = SELECTEDVALUE(Products[Category], "Multiple")
VAR RowCount = COUNTROWS(Sales)
VAR FilteredProducts = COUNTROWS(VALUES(Products[ProductName]))
RETURN
"Year: " & SelectedYear &
" | Category: " & SelectedCategory &
" | Sales Rows: " & RowCount &
" | Products: " & FilteredProducts
Technique 5: Table Variable Inspection
When working with table variables, verify they contain expected rows.
// Debug table variable contents
Top Products Debug =
VAR TopProducts =
TOPN(5, Products, [Total Sales], DESC)
VAR ProductCount = COUNTROWS(TopProducts)
VAR ProductList =
CONCATENATEX(
TopProducts,
Products[ProductName],
", "
)
RETURN
"Count: " & ProductCount & " | Products: " & ProductList
Performance Benefits
Understanding why variables improve performance helps you use them strategically for maximum impact.
How DAX Engine Handles Variables
When the DAX engine encounters a variable, it evaluates the expression once and caches the result. Every subsequent reference to that variable retrieves the cached value instead of recalculating.
This is fundamentally different from what happens without variables, where identical expressions are evaluated independently each time they appear.
Performance Comparison
// SLOW: Expression evaluated 3 times
Growth Status =
IF(
DIVIDE(
SUM(Sales[Amount]) - CALCULATE(SUM(Sales[Amount]), SAMEPERIODLASTYEAR(Dates[Date])),
CALCULATE(SUM(Sales[Amount]), SAMEPERIODLASTYEAR(Dates[Date]))
) > 0.1,
"High Growth",
IF(
DIVIDE(
SUM(Sales[Amount]) - CALCULATE(SUM(Sales[Amount]), SAMEPERIODLASTYEAR(Dates[Date])),
CALCULATE(SUM(Sales[Amount]), SAMEPERIODLASTYEAR(Dates[Date]))
) > 0,
"Positive Growth",
"Declining"
)
)
// FAST: Each expression evaluated once
Growth Status =
VAR CurrentSales = SUM(Sales[Amount])
VAR PriorSales =
CALCULATE(SUM(Sales[Amount]), SAMEPERIODLASTYEAR(Dates[Date]))
VAR GrowthRate = DIVIDE(CurrentSales - PriorSales, PriorSales, 0)
RETURN
SWITCH(
TRUE(),
GrowthRate > 0.1, "High Growth",
GrowthRate > 0, "Positive Growth",
"Declining"
)
When Performance Gains Are Greatest
- Complex CALCULATE expressions: Time intelligence and filter modifications are expensive
- Iterator functions: SUMX, FILTER, and other iterators over large tables
- Multiple references: Any expression used more than once
- Nested conditions: IF/SWITCH statements that reuse the same comparisons
- Large datasets: Performance gains scale with data volume
Best Practices
When to Use Variables
Always use variables when:
- An expression is used more than once
- The formula has more than 3-4 lines
- Complex logic needs to be broken into steps
- You need to capture filter context for later comparison
Optional for simple formulas:
// Simple enough without variables
Total Sales = SUM(Sales[Amount])
// Variables add clarity but aren't required
Profit = SUM(Sales[Revenue]) - SUM(Sales[Cost])
Common Mistakes to Avoid
Mistake 1: Forgetting RETURN
// WRONG - missing RETURN
Total =
VAR Amount = SUM(Sales[Amount])
Amount // Error!
// CORRECT
Total =
VAR Amount = SUM(Sales[Amount])
RETURN
Amount
Mistake 2: Referencing Variables Out of Order
// WRONG - Profit referenced before defined
Margin =
VAR Margin = DIVIDE(Profit, Revenue) // Error!
VAR Revenue = SUM(Sales[Revenue])
VAR Profit = Revenue - SUM(Sales[Cost])
RETURN
Margin
// CORRECT - define in dependency order
Margin =
VAR Revenue = SUM(Sales[Revenue])
VAR Cost = SUM(Sales[Cost])
VAR Profit = Revenue - Cost
VAR MarginCalc = DIVIDE(Profit, Revenue)
RETURN
MarginCalc
Mistake 3: Trying to Modify Variables
// WRONG - variables are immutable
Running =
VAR Total = 0
VAR Total = Total + SUM(Sales[Amount]) // Error!
RETURN
Total
// CORRECT - each variable is independent
Running =
VAR Base = SUM(Sales[Amount])
VAR Adjusted = Base * 1.1
RETURN
Adjusted
Mistake 4: Context Capture Confusion
Variables capture the filter context when defined. This can cause unexpected results if you are not careful.
// Context captured at definition, not at RETURN
Sales with Context =
VAR SalesAmount = [Total Sales] // Captures CURRENT context
VAR AllSales =
CALCULATE(
[Total Sales],
ALL(Products) // Different context
)
RETURN
SalesAmount // Returns value from original context,
// not affected by ALL(Products)
💡 Remember
Variables freeze the filter context at the moment of definition. This is powerful for comparisons but can be confusing if you expect the context to change.
Conclusion
Variables are not just a nice-to-have feature in DAX; they are essential for writing professional-quality code. They make your formulas readable by giving meaningful names to intermediate calculations. They improve performance by eliminating redundant evaluations. They enable systematic debugging by letting you inspect each step of complex logic.
Start using variables today. Even for simple formulas, building the habit will serve you well as your DAX complexity grows. Your future self, your colleagues, and anyone who maintains your reports will thank you.
Remember the key principles: name variables descriptively, define them in dependency order, use them for any repeated expression, and leverage them for debugging. These practices will elevate your DAX from functional to exceptional.