
Data Analysis Expressions (DAX) is the backbone of Power BI, enabling powerful calculations and insights. One of the most important aspects of DAX is how it works with relationships between tables. Understanding and mastering these relationships is key to building accurate, flexible, and efficient data models.
Why Relationships Matter
- Relationships define how tables interact in your model.
- They allow filters and calculations to flow across multiple tables.
- Without proper relationships, measures and calculated columns may return misleading results.
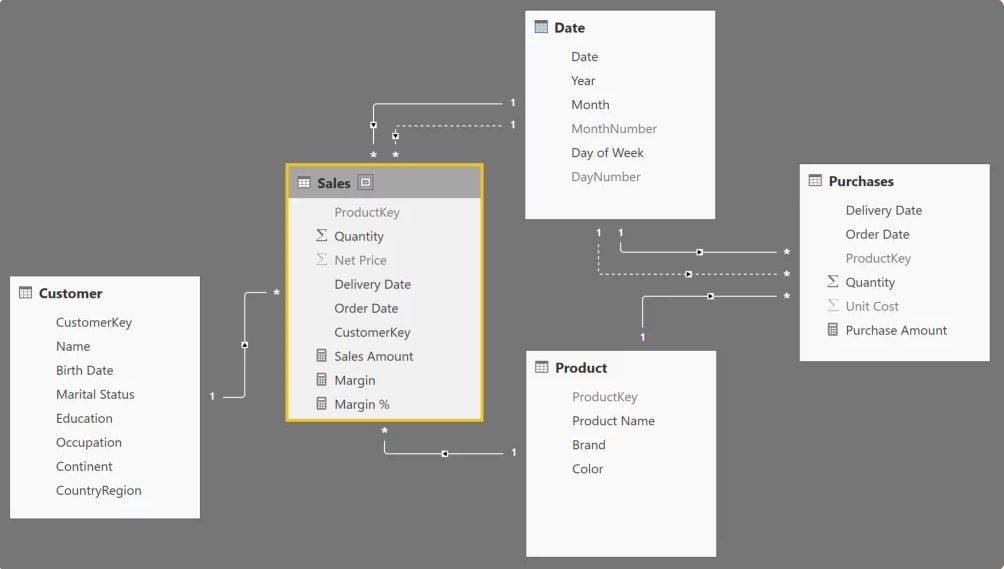
Example Model
Imagine a simple data model with three tables:
- Sales
- Customers
- Products
A relationship connects them through keys like CustomerID and ProductID.
Understanding Relationship Types
When designing a data model in Microsoft Power BI, you will typically encounter three main relationship types.
One-to-Many (1:*)
This is the most common relationship.
Example:
Customers (1) → Sales (*)
One customer can generate multiple sales transactions.
Many-to-One (*:1)
This is simply the reverse direction.
Sales (* ) → Customers (1)
Many-to-Many (:)
Occurs when both tables contain duplicate keys.
Example:
Students ↔ Courses
A student can enroll in multiple courses, and a course can contain multiple students.
Many-to-many relationships should be used carefully because they can introduce ambiguous filtering behavior.
Core DAX Functions for Relationships
| Function | Purpose | Example Use Case |
| RELATED | Fetches a column from a related table | Get customer name from Customers into Sales |
| RELATEDTABLE | Returns all rows related to current row | Find all orders linked to a specific customer |
| USERELATIONSHIP | Activates an inactive relationship temporarily | Switch between OrderDate and ShipDate |
| TREATAS | Creates a virtual relationship | Apply filters without a physical relationship |
Practical Scenarios
1. Multiple Date Relationships
A Sales table may contain multiple date columns, such as OrderDate and ShipDate. Only one can be active at a time. Using USERELATIONSHIP, you can activate an inactive relationship inside a measure:
Sales by Ship Date =
CALCULATE(
SUM(Sales[Amount]),
USERELATIONSHIP(Sales[ShipDate], Calendar[Date])
)
2. Virtual Relationships with TREATAS
Sometimes tables cannot be connected physically due to differences in structure or granularity. In these situations, TREATAS can simulate a relationship:
Sales by Custom Calendar =
CALCULATE(
SUM(Sales[Amount]),
TREATAS(CustomCalendar[Date], Sales[OrderDate])
)
This applies filters from CustomCalendar to the Sales table, behaving as if a relationship exists.
3. Fetching Values Across Tables
The RELATED function retrieves values from a related table. Commonly used in calculated columns:
Customer Name =
RELATED(Customers[Name])
Typical use cases include retrieving customer names, product categories, or region information
🌟 Best Practices for Working with Relationships
Use a Star Schema: Recommended design for analytical models. Structure:
- Fact Table → Sales, Transactions
- Dimension Tables → Customers, Products, Date, Region
- Avoid unnecessary bidirectional filtering.
- Minimize many-to-many relationships (use bridge tables instead).
- Prefer measures over calculated columns for efficiency.
Conclusion
Relationships are the foundation of effective DAX modeling. They determine how filters flow across tables and how calculations combine data from different sources. By mastering functions such as:
RELATEDRELATEDTABLEUSERELATIONSHIPTREATAS
you can build powerful Power BI reports and scalable data models.