

Overdue payments are one of the most pressing financial challenges organizations face. When invoices sit unpaid beyond their due date, cash flow suffers, and without visibility into how long payments have been outstanding, finance teams are left guessing. Power BI offers a powerful way to build an aging dashboard that not only tracks overdue payments but also highlights the severity and risk associated with each one.
In this tutorial, we will walk you through the process of creating an accounts receivable aging report in Power BI from preparing your data, to building the model, to designing a dashboard that gives your team instant clarity.
What Is Payment Aging?
Payment aging refers to the process of categorizing outstanding invoices based on how long they have remained unpaid. Invoices are grouped into aging buckets typically 0–30 days, 31–60 days, 61–90 days, and 90+ days to give finance teams a clear picture of where their receivables stand.
The older an invoice becomes, the higher the risk of non-payment. An effective aging report helps organizations:
- Identify which customers are consistently late or non-responsive.
- Prioritize collection efforts based on the age and value of overdue invoices.
- Make informed decisions about credit limits and payment terms.
Step 1: Prepare Your Data
Before building anything in Power BI, your data needs to be structured correctly. You will need a dataset that includes the following fields at a minimum(Download available dataset)
| Field | Description |
| Invoice Number | A unique identifier for each invoice. |
| Customer Name | The name or ID of the customer who owes the payment. |
| Invoice Date | The date the invoice was issued. |
| Due Date | The date by which payment was expected. |
| Amount | Invoiced Amount |
| Payment Status | Whether the invoice is paid or not. |
Step 2: Load Your Data into Power BI
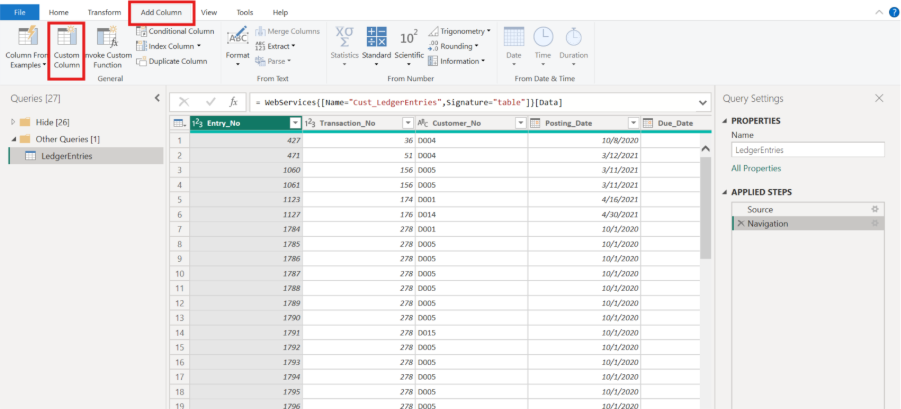
Open Power BI Desktop and load your data using the Get Data function
Step 3: Create the Aging Column
This is the most important step. You need to calculate how many days each invoice has been overdue, and then assign it to an aging bucket. This is done using a calculated column with DAX (Data Analysis Expressions) or in power query using add column .
For this tutorial let us user Power Query to achieve our desired outcome.
Days Overdue
First, calculate the number of days each invoice is overdue:
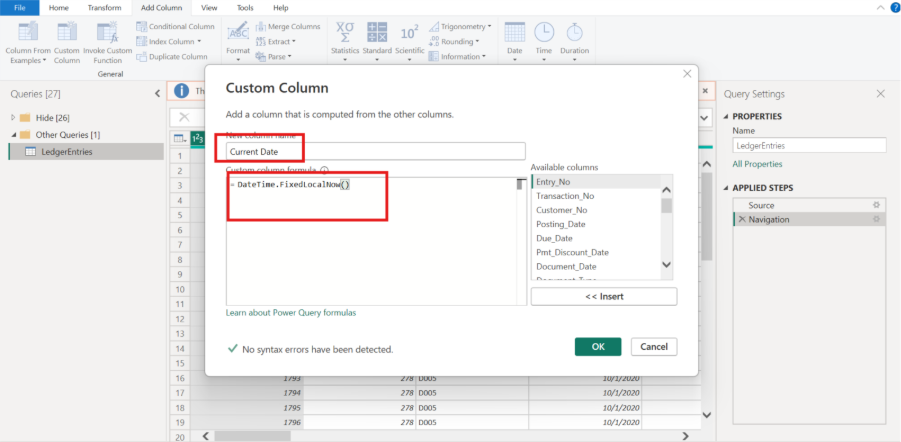
i).Add Current Date Column
We add a new column that captures the current date and time using DateTime.LocalNow(). This will serve as our reference point for calculating how overdue each entry is.
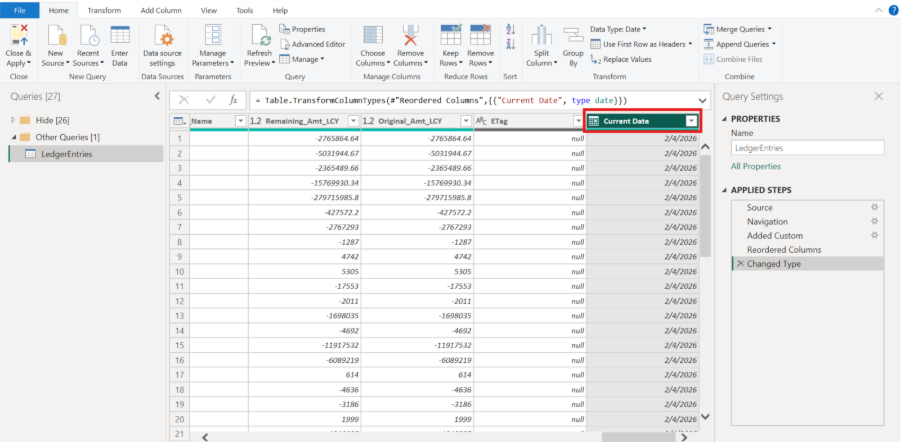
ii). Convert column to Date Data Type
Convert the current date column from datetime datatype to date.
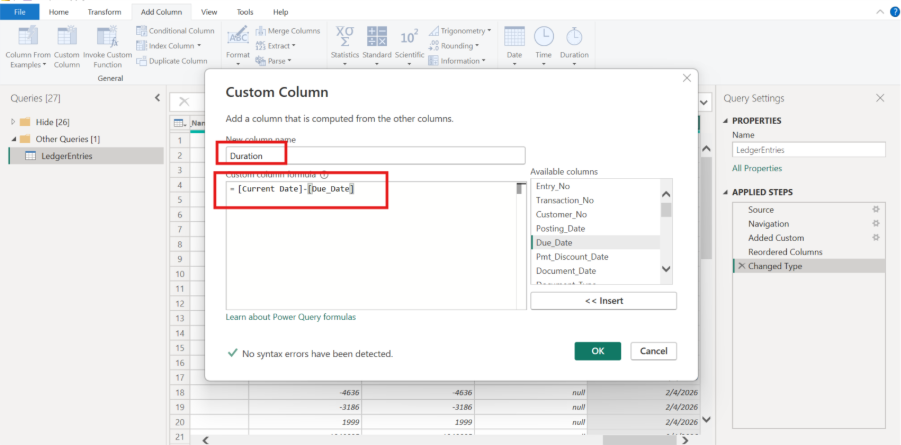
 iii). Calculate Days Overdue
We create a new column that subtracts the Due Date from the Current Date, giving us the number of days each entry is overdue.
iv). Convert Duration column to Whole Number Data Type
Aging Bucket
Next, use a nested IF statement to assign each invoice to an aging bucket based on the number of days overdue. The conditional logic creates standard aging categories that are commonly used in accounts receivable reporting:
- 0-30 days (current)
- 31-90 days (slightly overdue)
- 91-180 days (seriously overdue)
- 181-360 days (significantly overdue)
- Over 360 days (critical collection required)
Step 4: Build Your Dashboard Visuals
Now that we've built our aging analysis in Power Query, it's time to bring the data to life through compelling visualizations. The right visuals can transform rows of numbers into clear, actionable insights that drive better business decisions.
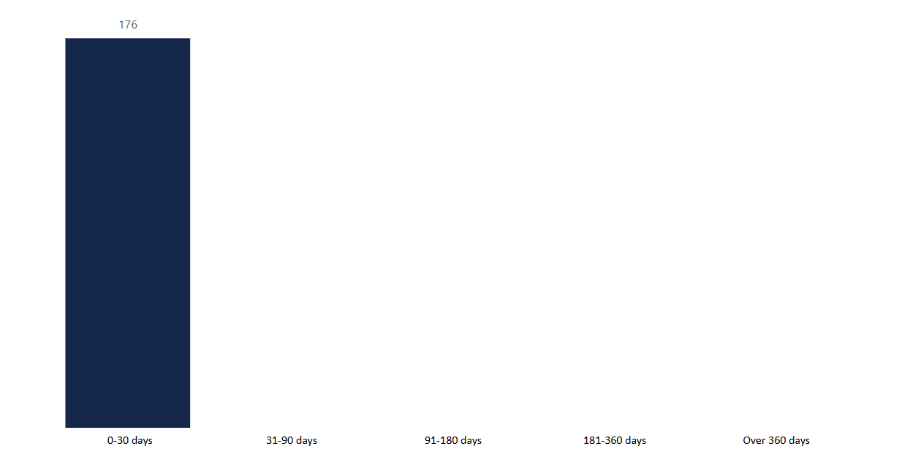
- Stacked Bar Chart: Aging Distribution by Amount
This visual immediately shows you where your biggest collection challenges lie. If you see a massive bar in the "Over 360 days" category, you know you have a serious problem that needs immediate attention.
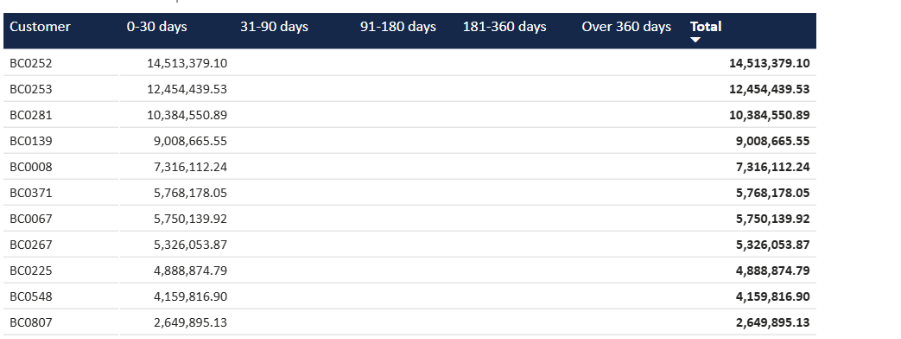
- Matrix Table: Customer-Level Aging Detail
This gives you the granular detail needed for action. You can quickly identify which specific customers have the oldest receivables and prioritize your collection calls accordingly.
Conclusion
Check out our website for more information www.sibasi.com